As I’ve mentioned recently, I took up timeboxing late into this fall quarter.1 It’s had a tremendous positive effect on my productivity as a student during the rush of the quarter. I’d like to take advantage of another opportunity that timeboxing offers in retrospect: data analysis!
Unfortunately, I only began timeboxing with four weeks of classes left, so I won’t be able to find a clear picture of my time management this entire quarter. What you’ll find here is rather an image of how I spent my days after I had adjusted fairly completely to life at Stanford.2
Tracking methodology
I’ll provide a quick description now of how I planned and maintained my schedule over the past weeks. Each day would proceed as follows:
- After waking, I would schedule the day. I examined the tasks for the day and allotted nearly every minute to specific items. (These “tasks” were not all work-focused — I would also schedule things like meals, social outings, etc.)
- As the day progressed, I would adjust the schedule. Events would inevitably run over, and new opportunities would inevitably crop up. I adjusted my schedule as I went, changing it so that a glance at a past day would tell me exactly what I had done in each hour.
- Near the end of the day, I would finalize the schedule. This activity usually consisted of a rushed glance at the calendar on my phone, followed by a few quick adjustments to any mistakes that I had made in recording the day.
All of this work produced a calendar that looked like the following.
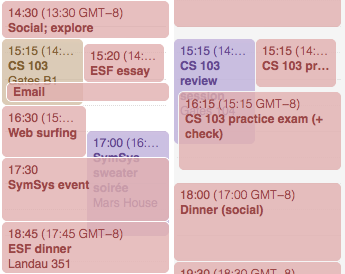
It seemed like a daunting task at first to adhere to such a strict schedule. But I found that by sticking to the plans I set out beforehand, time management became a non-issue.
Analysis
“A non-issue,” he says? Let’s see how I spent my time over the final weeks of the quarter. I built a tool to process a calendar export and generate a flexible spreadsheet, then manually categorized each event instance into one of several categories:
- Career: resume work, networking, tech talks, etc.
- Class: Stanford lectures, seminars, discussion sections
- Extra: cleaning, reading and writing (not directly related to a class), side projects, web surfing, etc.
- Health: exercise, health tracking
- Meals: all events centered around food (both social and non-social)
- School extras: club meetings, etc.
- Social: spending time with friends, Skyping, etc.
- Schoolwork (abbreviated “SW”): all schoolwork not done in class (both consumption, e.g., reading and watching lectures; and production, e.g., writing essays, working on problem sets)
Time distribution over time
Grouping by week, here is my proportional distribution of time among those categories:3
Some interesting trends are visible here, and are worth spelling out:
- “Extra” time substantially increased. As the quarter progressed, I made an effort to focus more and more on side-projects and reading on my own. It seems this effort was successful, and moreover it grew without too much impact on my time spent on schoolwork.
- Social time spiked in week 47. This is mostly due to a day-long off-campus trip. It was well-timed — my week was not dominated by schoolwork, and I had week 48 (the break) to catch up on any work missed.
- Schoolwork time is erratic at the end of the quarter. The large variance is mostly due to time spent writing essays, which were assigned at spaced intervals. To make this time allocation more regular, I should try to make sure I complete work at an even pace.4
- I gained better control of my meal time as the quarter progressed. I made an effort to establish a split between quicker meals alone and intentionally social meals, and it shows: I spent four hours less at dining tables in week 47 than in week 45.
- Social time has an inverse relationship with schoolwork time. This probably should not be surprising.
Time distribution per day of week
It might also be useful to examine my weekly routine. I grouped event instances by weekday and determined what proportion of each category composed each weekday:
Conclusions:
- Schoolwork time peaks at the start of the week. It decreases monotonically save for Thursday. This is likely an artifact of my class schedule for the quarter, which involved lots of early-week preparation (both consumption and production) for mid-week classes.
- Social time peaks at the end of the week. Social time seems to have a somewhat strong inverse relationship with schoolwork time on this level, as well.
- Mealtime proportions stay fairly constant. It’s good to have this as a reliable block of time.
Work / play split per day of week
I next lessened the granularity of the analysis a bit, simplifying the many categories into just two: work time and free time. Grouping by day of week, I calculated the median amounts5 of work and free time, then graphed their relationship:6
Interesting — there seems to be a “crossover” of free time and work time on the median Friday, a trend which continues into the median Saturday. The two categories then literally swap places on the early weekend!
It’s too early to conclude whether this is a healthy pattern: that is, to sustain a high workload during most of the week and suddenly plunge into free time over the early weekend. It might be worth spending a week trying a closer balance: that is, attempting to keep work and free time more consistent across days of the week.
Conclusion
This sample of my schedule is too small to make any sweeping generalizations or decree any kind of absolutely necessary changes in my life. There are some major trends that suggest an underlying consistent behavior, though, that I want to continue to watch in the future:
- Late-week spikes in social time. I’m not certain if this is a healthy thing — to put work over socializing for most of the week, that is, and then suddenly drop work at the week’s end.
- Erratic amounts of schoolwork time. If this pattern continues, I need to think about how to better spread out work over time.7
I’d love to reach a point where the time I need to dedicate to the more everyday categories (schoolwork, class, meetings, etc.) is constant. With this time allotment under control, I can better reason about where to fit everything else in my schedule. More consistent structure would be welcome for sure!
I’m seeing an entire new side of timeboxing now. I’ve gained several beneficial conclusions from this analysis, and see even more advantage in maintaining the timeboxing practice come next quarter.8 Come back next quarter for another time analysis — one which will actually be able to cover multiple months of data!
-
This timeboxing idea was shamelessly stolen from Peter Hurford’s excellent article on productivity. ↩
-
This is no less valuable, of course. I can tell myself that I’ve reached some sort of optimum schedule, but this may well be a local optimum. The analysis here should hint at such a situation if so. ↩
-
I did not track my time over week 48 (Stanford’s Thanksgiving break), and so it has been omitted from the analysis. ↩
-
I think my problem, believe it or not, is that I finish things too early in hopes of avoiding the tendency for procrastination. I distributed the work for a 15-page essay over two weeks, for example, even though we were assigned four weeks to complete it. ↩
-
The choice of median over average was very important: day-trips (fully free time) and conferences (fully work time) would have otherwise skewed the mean values. ↩
-
Note that the proportions of the times rather than the amounts themselves are graphed. ↩
-
As I mentioned earlier, my current problem may actually be due to front-loading assignments too much. I might want to continue the practice of starting things the day they are due, but attempt to spread items out more up until the few days before the assignments are due. ↩
-
I’d sure hope so, given my quarterly commitment. ↩